基本名詞定義
變數 (variable): 母群體 (population) 或取樣 (sample) 的某種屬性。
舉例來說,母群體為某個班級的學生,想研究的變數為數學期末考的成績。變數的值域 (values of the variable): 變數所有可能呈現的值的集合。
舉例來說,想研究的變數是數學期末考的成績,值域為0-100的整數。資料 (data): 對於一項變數,所觀測到的值的集合。
舉例來說,班級有5名學生,想研究的變數是數學期末考的成績,取得的資料為52, 76, 82, 86, 95的整數。
資料的形態
區間資料 (interval data, quantitative data, numerical data)
實數 (real numbers)。
可以對區間資料進行各種運算。
類別資料 (nominal data, qualitative data, categorical data)
舉例來說,變數是班長候選人,值域為「沈佳宜」、「柯景騰」。
有時我們會為類別指定數值。以上例而言,可以指定「沈佳宜」為 1,「柯景騰」為 2。
對於類別資料,唯一能進行的運算是加總各個類別發生的次數。
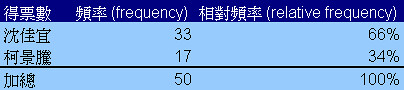
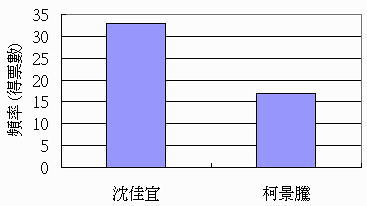
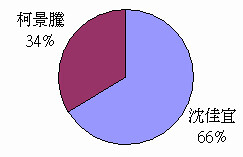
接續上例,加總「沈佳宜」得 33 票,「柯景騰」得 17 票。
序位資料 (ordinal data)
舉例來說,變數是餐廳的評價,值域為「非常好吃」、「好吃」、「普通」、「難吃」、「非常難吃」。
當我們為序位資料指定數值時,需要保持數值的順序性。以上例而言,可以指定「非常好吃」為 5、「好吃」為 4、「普通」為 3、「難吃」為 2、「非常難吃」為 1。
對於序位資料,能夠進行的運算包含:
(1) 加總各個類別發生的次數。
(2) 和排序相關的運算,舉例來說,計算中位數 (median)。
描述類別資料的圖表技巧
頻率分佈 (frequency distribution) 及相對頻率分佈 (relative frequency distribution) 的表格
直條圖 (Bar Chart)
圓餅圖 (Pie Chart)
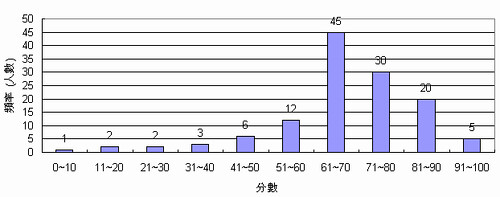
描述區間資料的圖表技巧
範例資料:
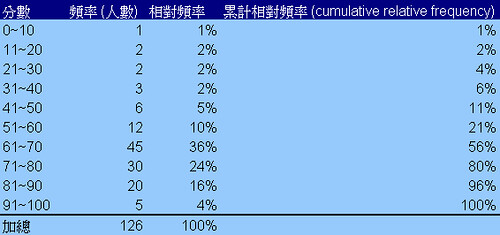
直方圖 (Histogram)
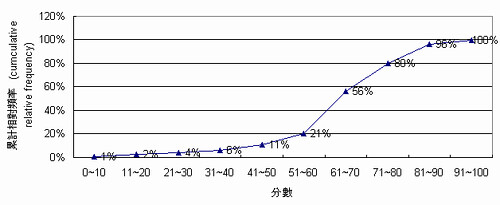
肩形圖 (Ogive)
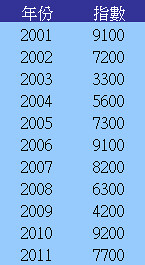
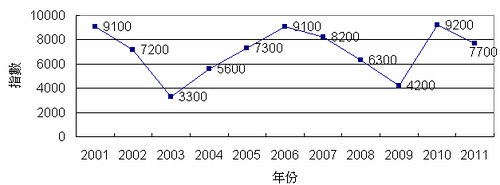
描述時間序列資料 (time-series data)
範例資料:
線條圖 (Line Chart)
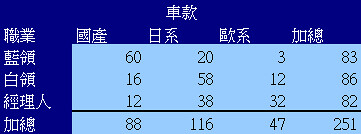
描述兩個類別變數之間的關聯性
Cross-classification Table of Frequency
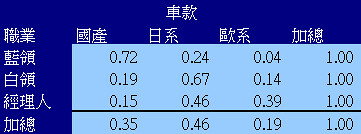
Cross-classification Table of Relative Frequency
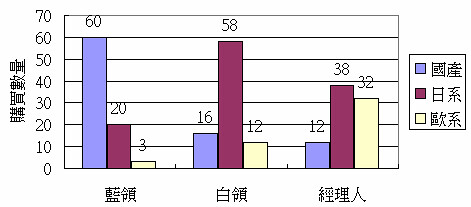
直條圖 (Bar Chart)
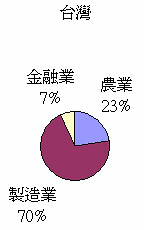
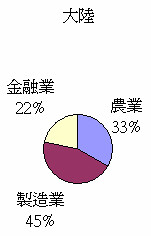
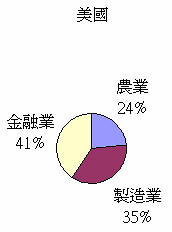
比較兩組以上的類別資料
範例資料:
圓餅圖
 |  |  |
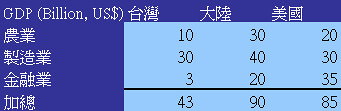
描述兩個區間變數之間的關聯性
範例資料:
散佈圖 (Scatter Diagram)
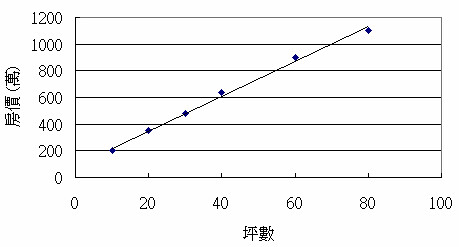
若呈現較強的線性關係,只是代表兩個變數之間的關聯性(correlation)高,並不代表於兩個變數之間一定有因果關係(causation)。
延伸閱讀
[書籍] Managerial Statistics, Chap 2 Graphic and Tabular Descriptive Techniques, 作者: Gerald Keller
[閱讀筆記] Google 必修的圖表簡報術: 選對有效的視覺元素 (Choosing an Effective Visual)
系列文章
[學習筆記] 統計學:基本概念
[學習筆記] 統計學:圖表描述技巧 (Graphic and Tabular Descriptive Techniques)
[學習筆記] 統計學:數值描述技巧 (Numerical Descriptive Techniques)
[學習筆記] 統計學:資料搜集及取樣 (Sampling)
[學習筆記] 統計學:機率 (Probability)
[學習筆記] 統計學:隨機變數及離散型機率分佈 (Random Variables and Discrete Probability Distributions)
[學習筆記] 統計學:連續型機率分佈 (Continuous Probability Distributions)
[學習筆記] 統計學:取樣分佈 (Sampling Distributions)
[學習筆記] 統計學:估計 (Estimation)
[學習筆記] 統計學:假設檢定 (Hypothesis Testing)